Diligence Insights
Guide · 4 min read
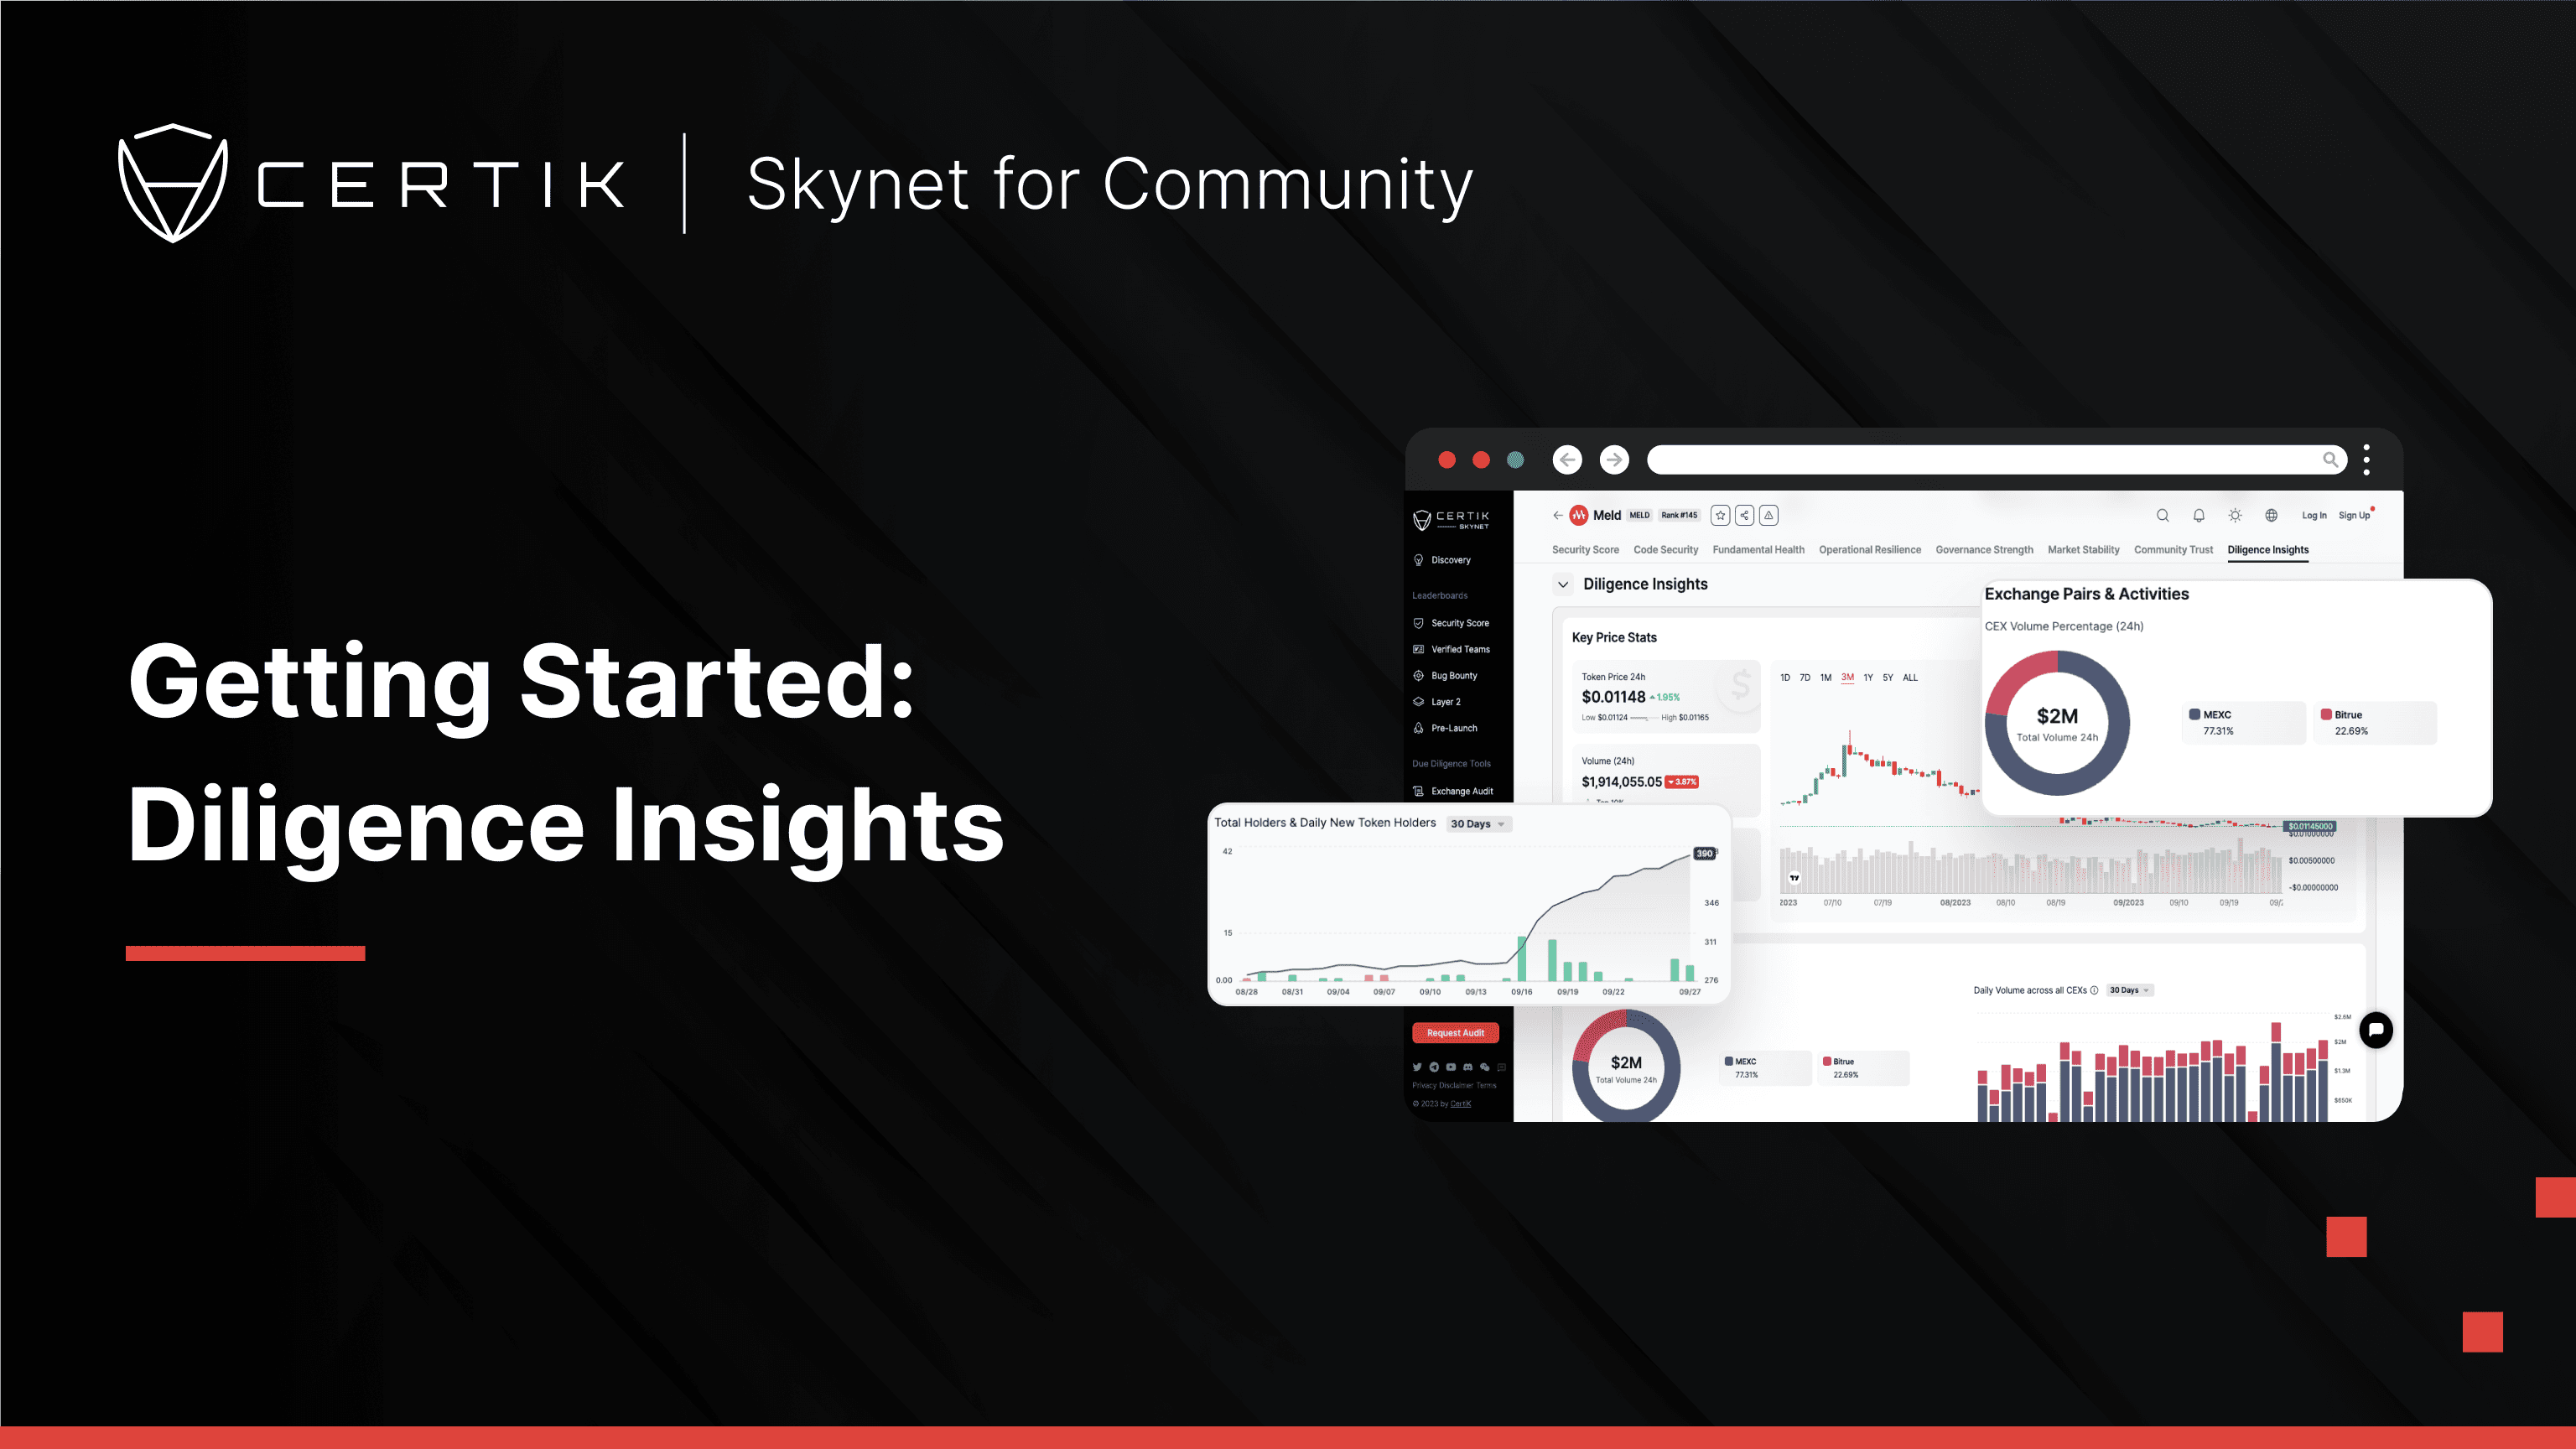
The Diligence Insights module helps you evaluate important on-chain metrics, exchange pair dynamics, activity on exchanges, and token holder data. By delving into on-chain metrics, it allows you to assess the project's operations and performance, while monitoring exchange pairs and activity enables you to gauge its presence and liquidity in the broader crypto market. Additionally, examining token holder data offers valuable insights into the project's community support and investor sentiment, aiding in the assessment of its long-term sustainability and growth potential.
The Key Price Stats section enable you to monitor a token’s financial performance, assess its market dynamics, and make informed decisions based on its historical and current pricing trends.
Token Price reflects the most recent trading price, allowing you to track its real-time market valuation. Trading Volume measures the total number of tokens bought and sold within the last 24 hours. Market Capitalization, or “Market Cap”, is a metric that represents the total value of all circulating tokens in the market. Lastly, there is a price graph that shows a token’s price movement over time, allowing you to track trends, fluctuations, and historical highs and lows.

The Exchange Pairs and Activities module offers a comprehensive overview of the token's trading dynamics across various cryptocurrency exchanges. Within this module, you will find two sections that visually represent the distribution of trading volume among different exchanges (both centralized and decentralized).

Pie Chart Analysis: The pie chart illustrates the percentage of trading volume attributed to each exchange. This representation allows you to quickly identify which exchanges dominate the token's trading activity and their relative market share.
Bar Chart Insights: Complementing the pie chart, the bar chart presents a more detailed breakdown of trading volume across exchanges, over a specific time period. You can toggle between 7-, 14-, 30-, and 60-days to see how daily volume across exchanges changes.
Within the Token On-Chain Metrics module, users can gain insight into a token's on-chain activities, shedding light on its usage and overall health.

This section presents valuable insights into the number of active users interacting with the token's blockchain. By understanding the level of user engagement, you gain a sense of the token's popularity and utility.
Additionally users can discover not only the total number of transactions involving the token but also insights into the number of tokens transferred. This information helps gauge the token's transactional activity and its role within the broader digital economy.
Token age metrics provide a glimpse into the token's lifecycle. Knowing how long tokens have been in circulation can offer insights the token's maturation within the market. These metrics are then available in a graph, to help visualize fluctuations in usage.
Another graph reveals the total gas fees paid for token transactions, highlighting the cost associated with utilizing the token. Additionally, the daily median gas price provides insights into the network's congestion and transaction costs, which can impact user behavior and token adoption.
Token holder distribution is an important consideration in Web3 analytics. A widely distributed token ownership can indicate a healthy and engaged community. When a project's tokens are held by a diverse group of individuals and entities, it suggests broad support and interest in the project. This can be crucial for the project's long-term success, as an engaged community is more likely to contribute to its development and adoption.

In this section, users can assess token holder diversity and concentration. These metrics offer insights into the number of token holders, the percentage of holders accounting for 50% of the total supply, the holdings of the top 100 wallet addresses, and their share of the overall token supply.
A graph at the bottom of the section charts the relationship between the total number of token holders and the influx of new token holders on a daily basis. Users can conveniently toggle between different time periods to observe how these dynamics evolve over time. Additionally, a wallet distribution graph shows the age distribution of wallets holding the token.
This information is important because it provides an in-depth understanding of how widely ownership of the token is dispersed among participants. It helps users gauge whether ownership is concentrated in the hands of a select few or distributed among a broad spectrum of holders.
Guide · 3 min read
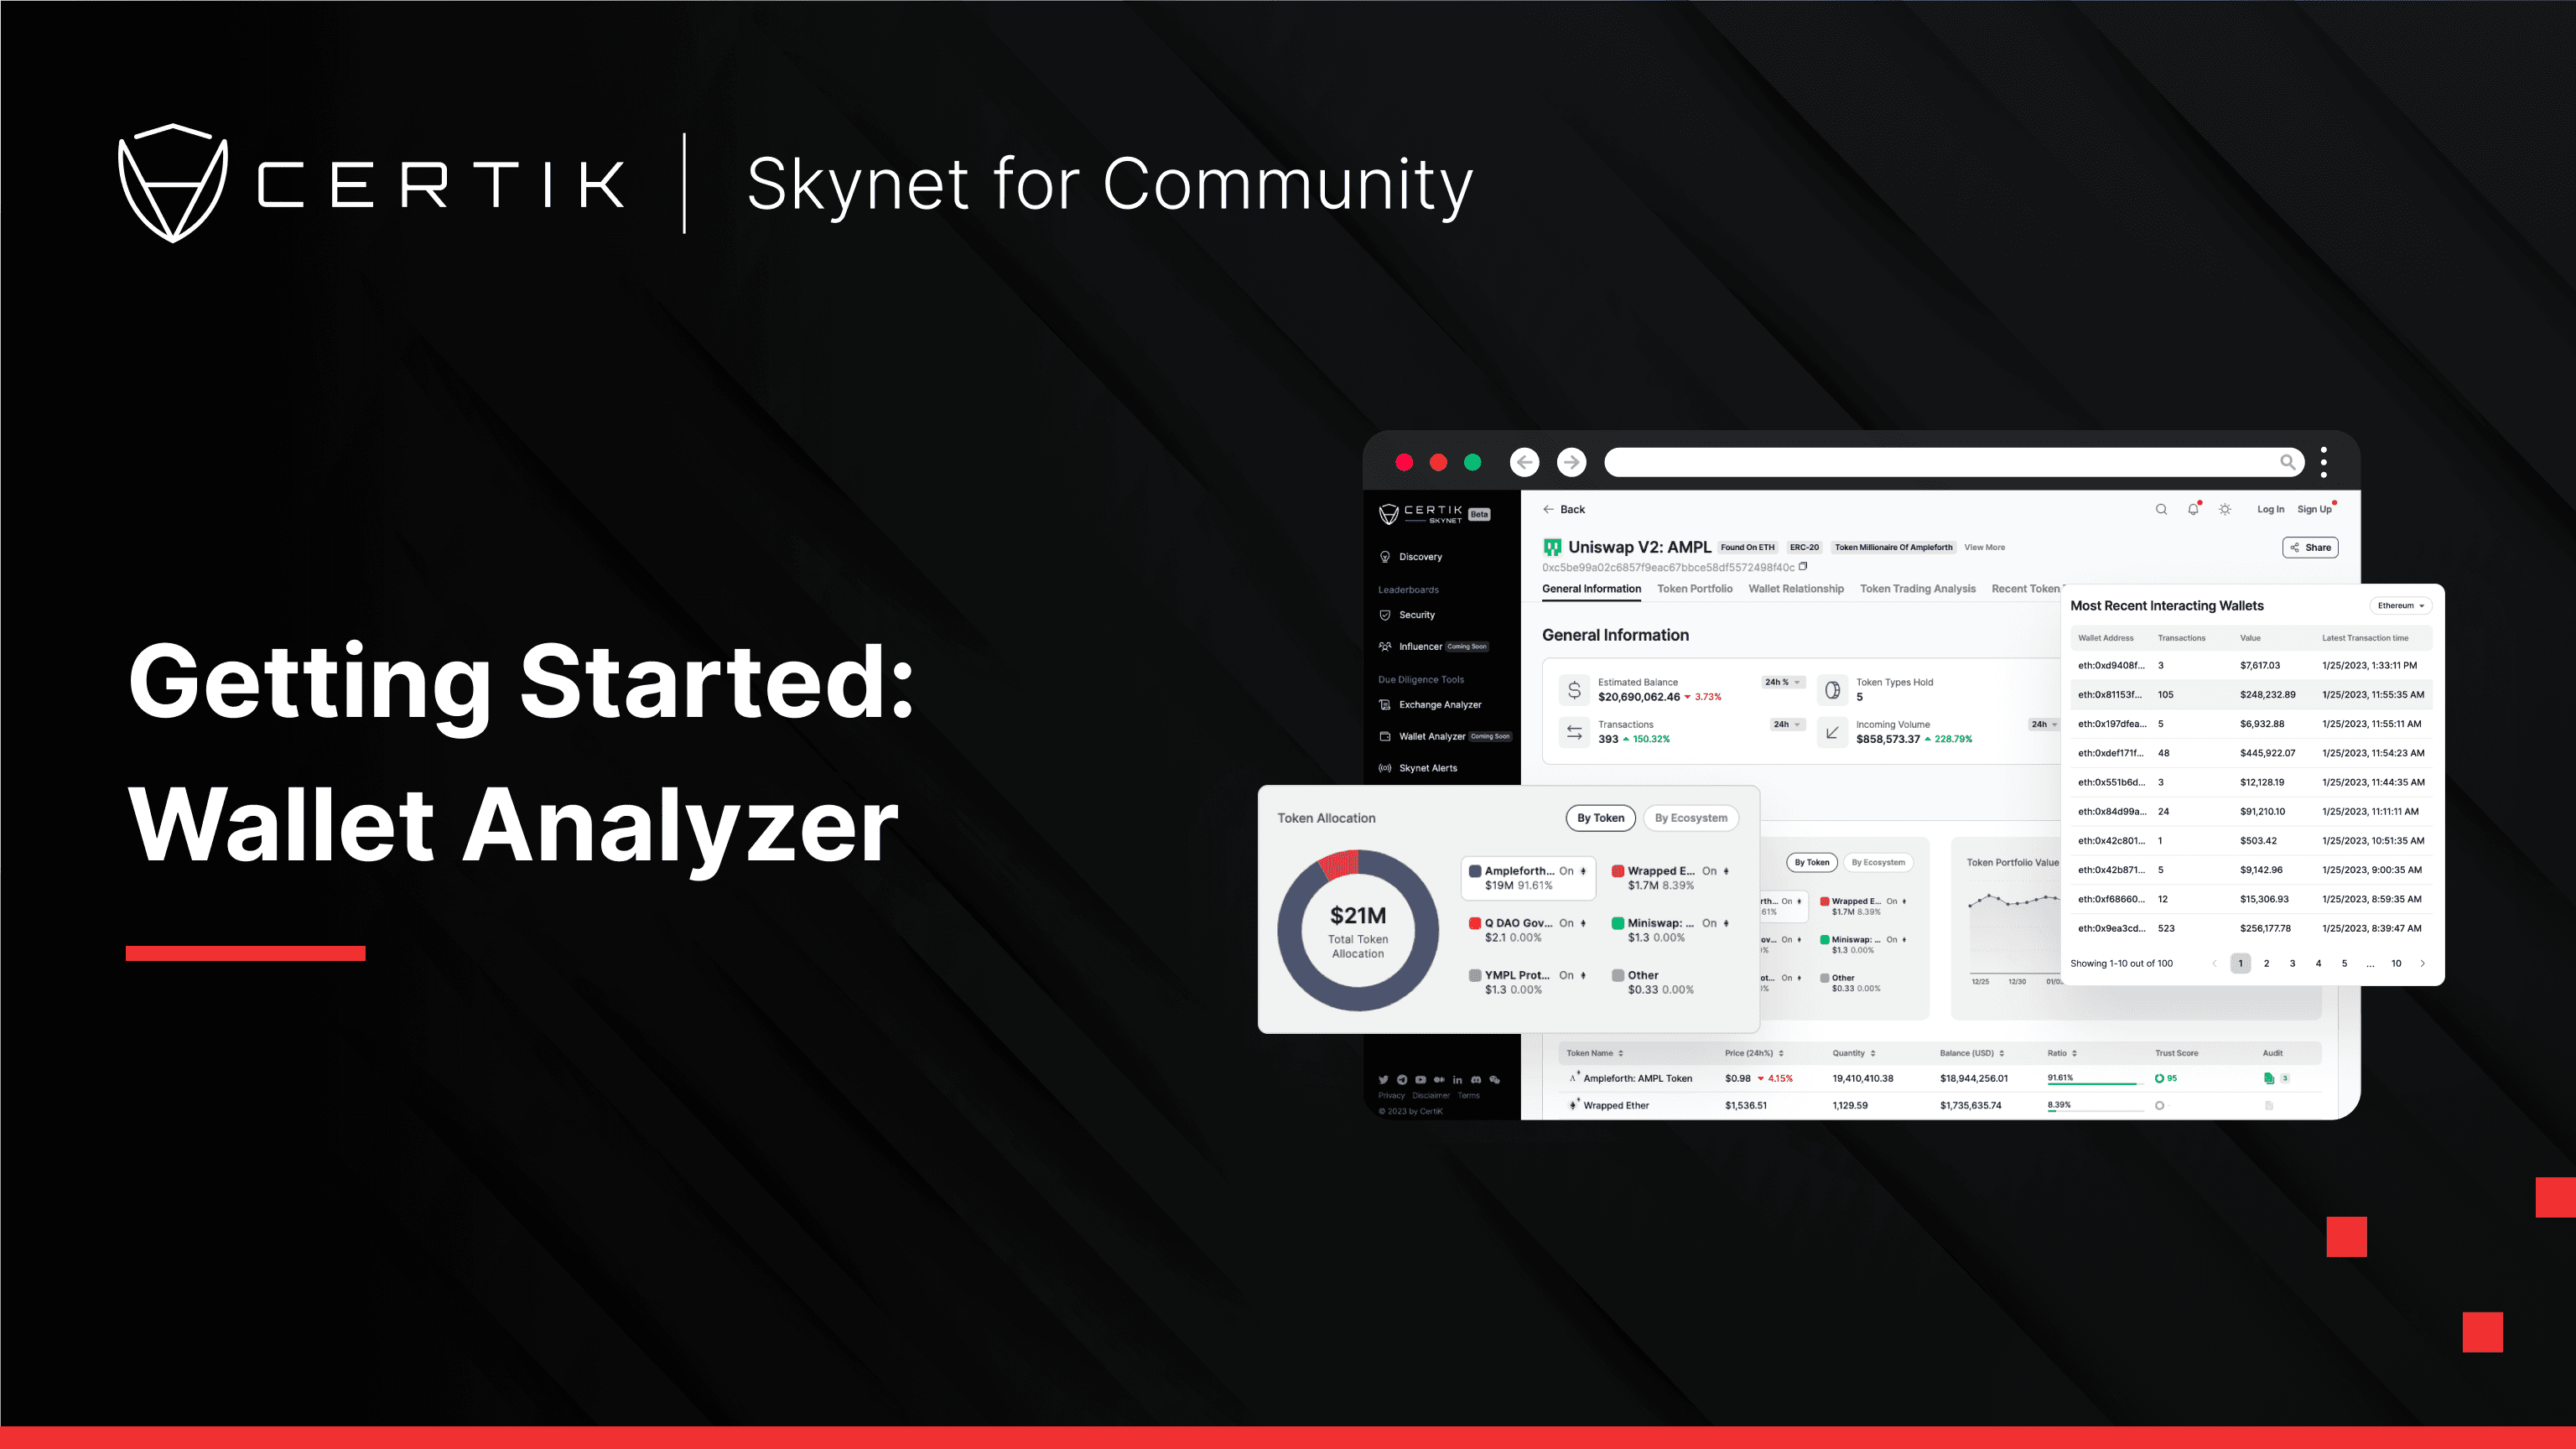
Wallet Analyzer
Wallet Analyzer provides insights on wallet addresses and makes it easy to decipher on-chain transactions between wallets.
Guide · 5 min read
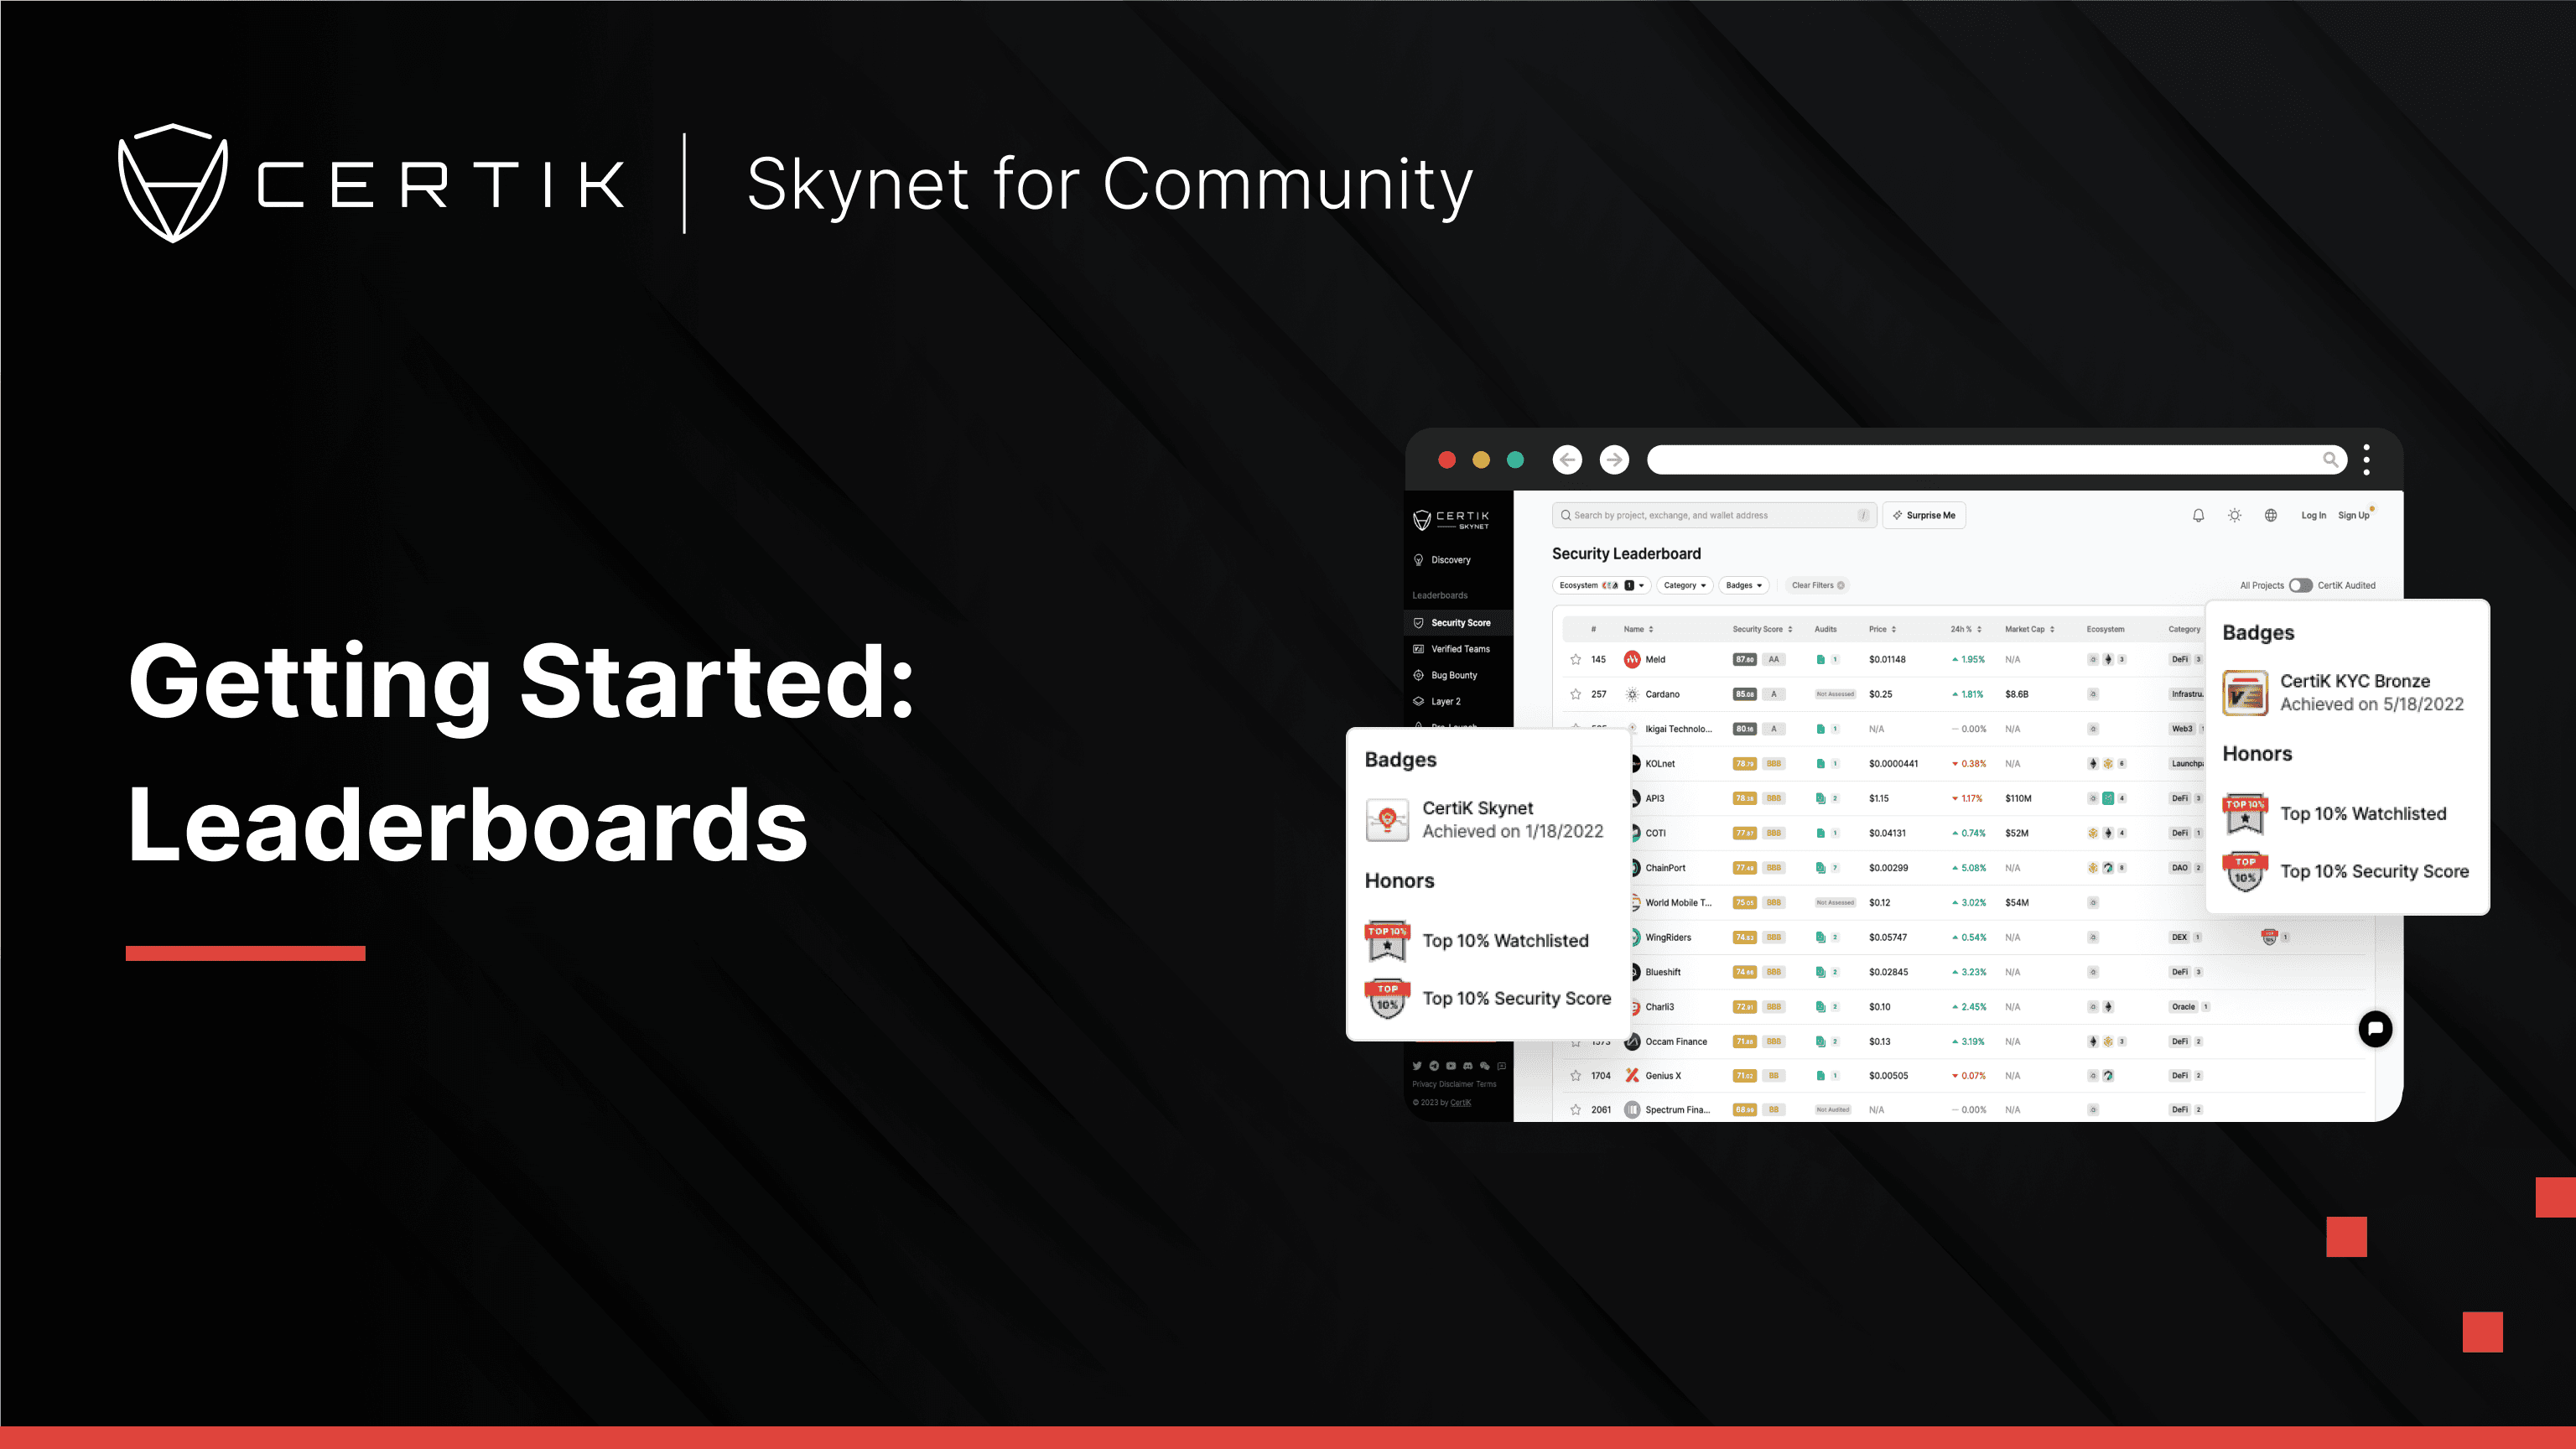
Leaderboards
Skynet Leaderboards: Discover rankings for security, verified teams, bug bounties, Layer 2, and pre-launch projects.
Guide · 2 min read
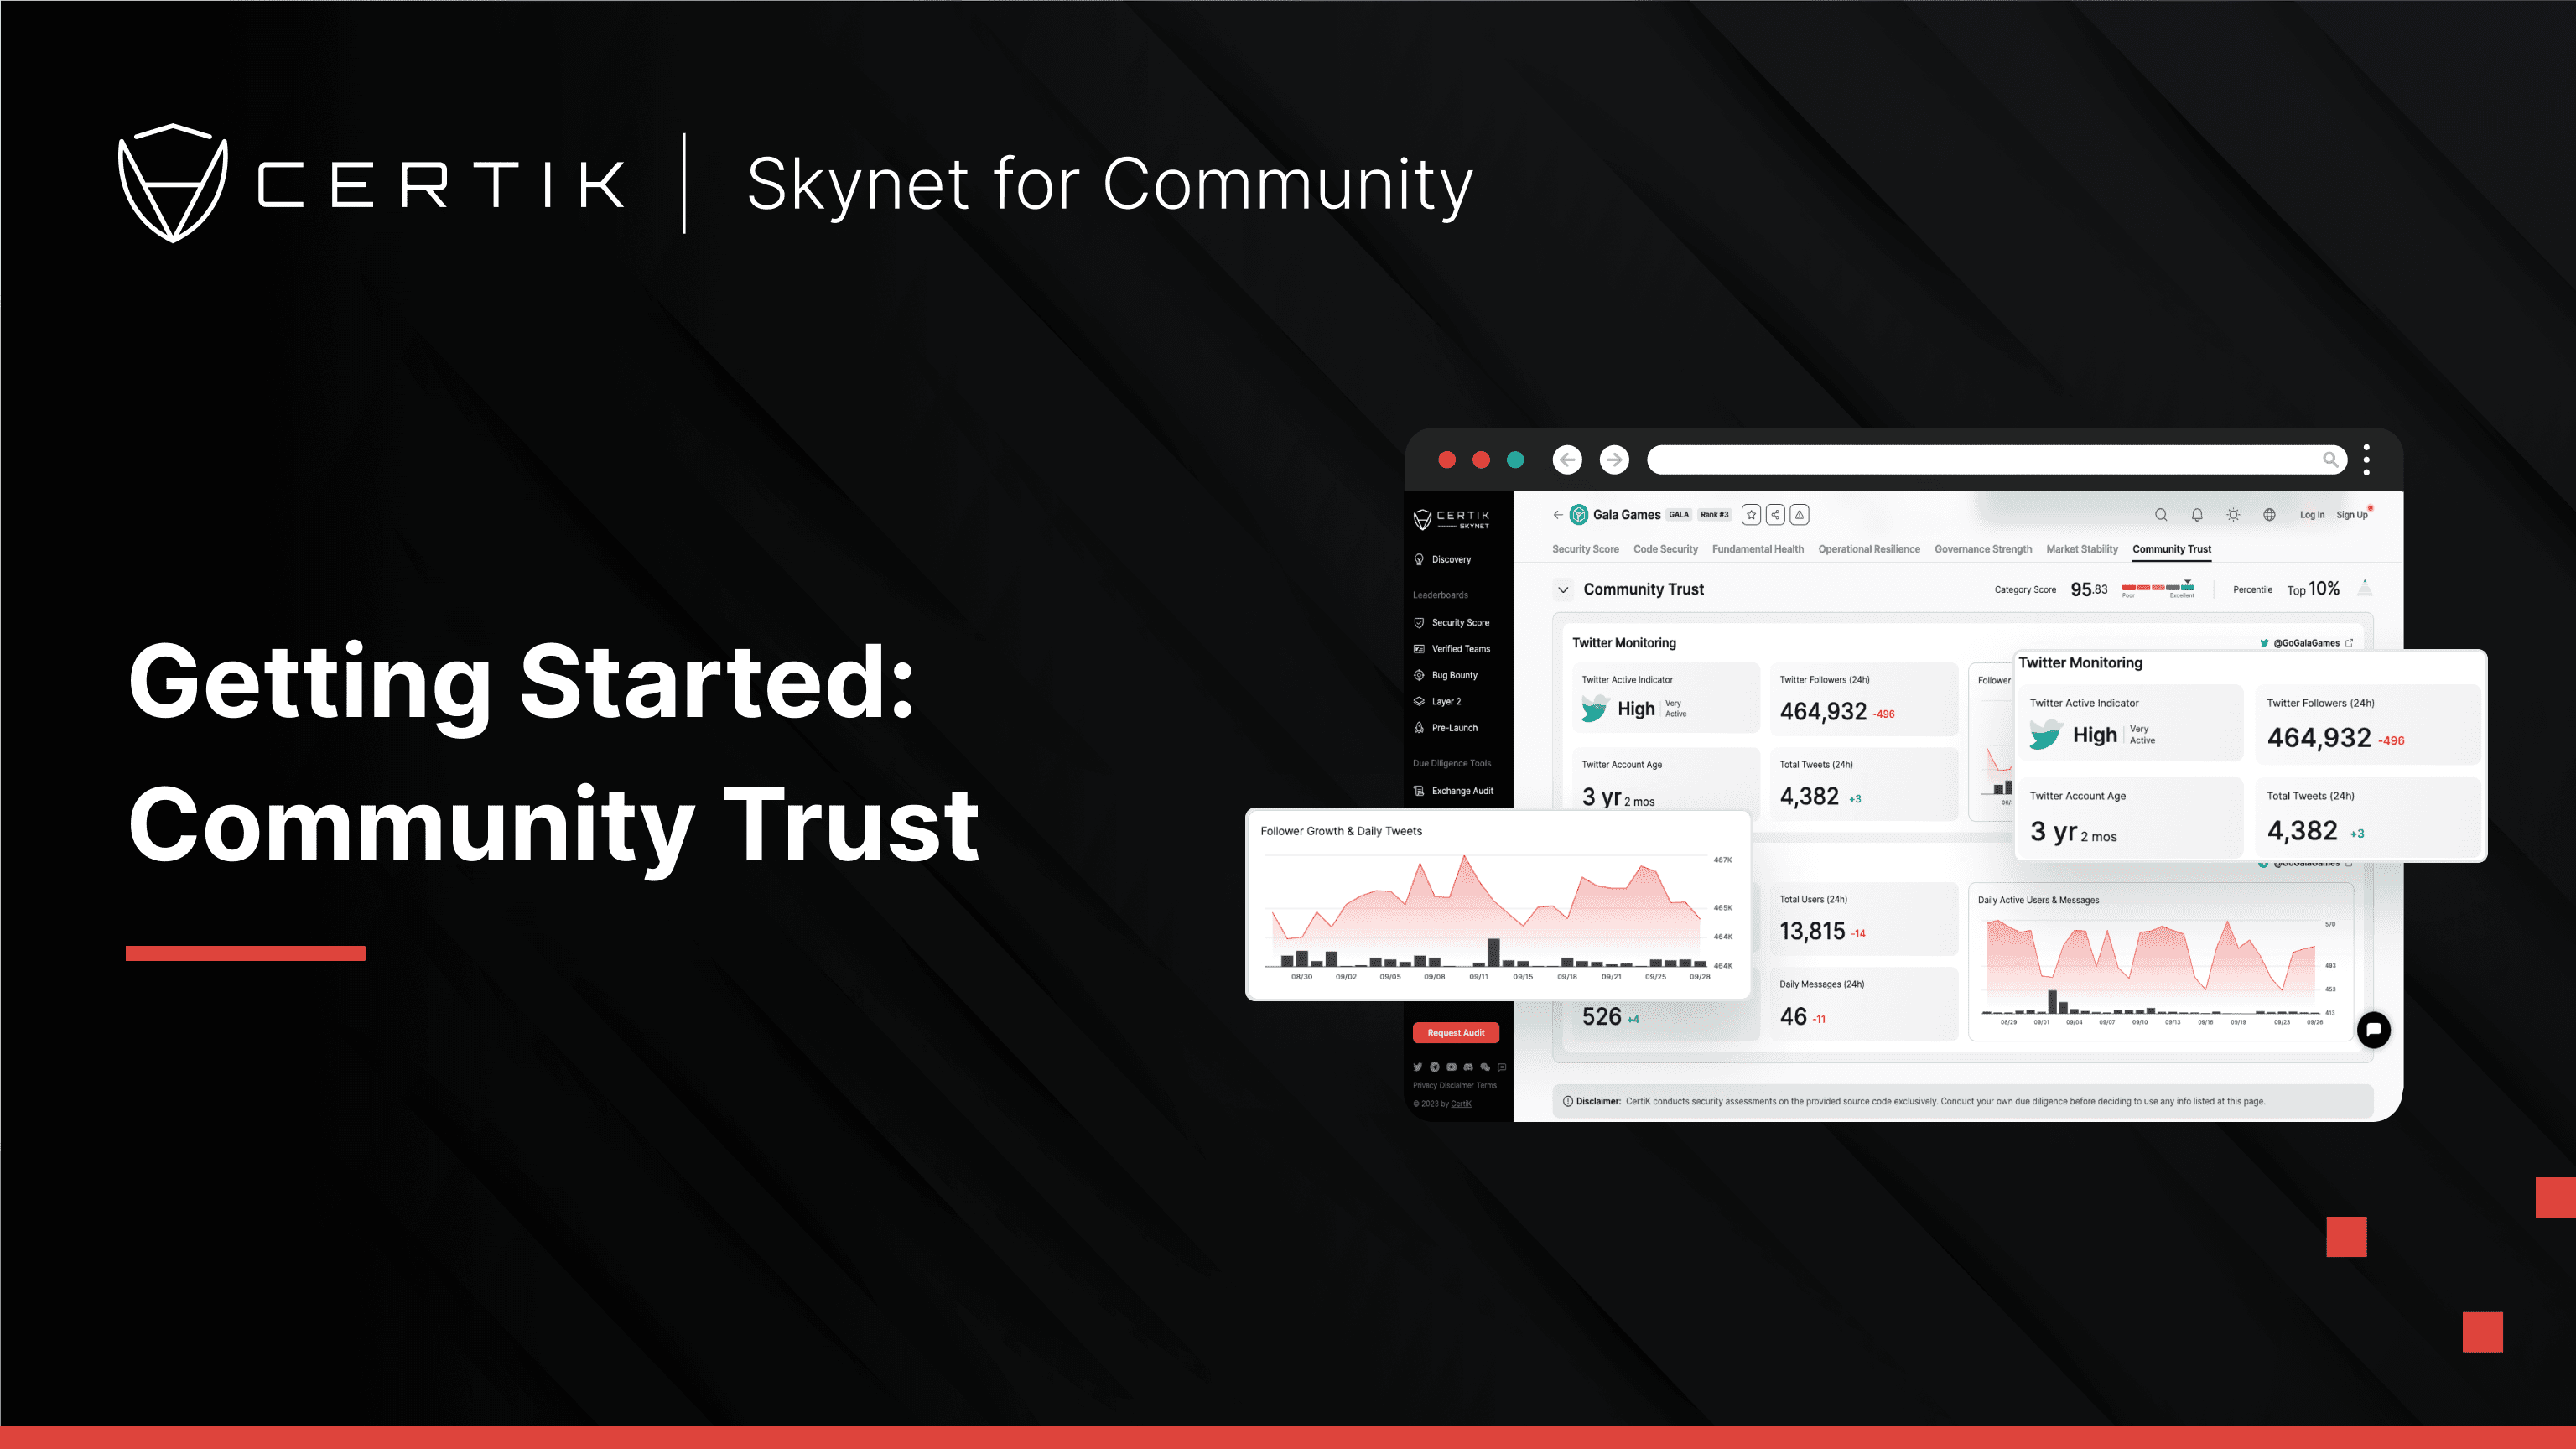
Community Trust
The Community Trust module assesses social engagement & sentiment on platforms like Twitter, Telegram, and Discord.
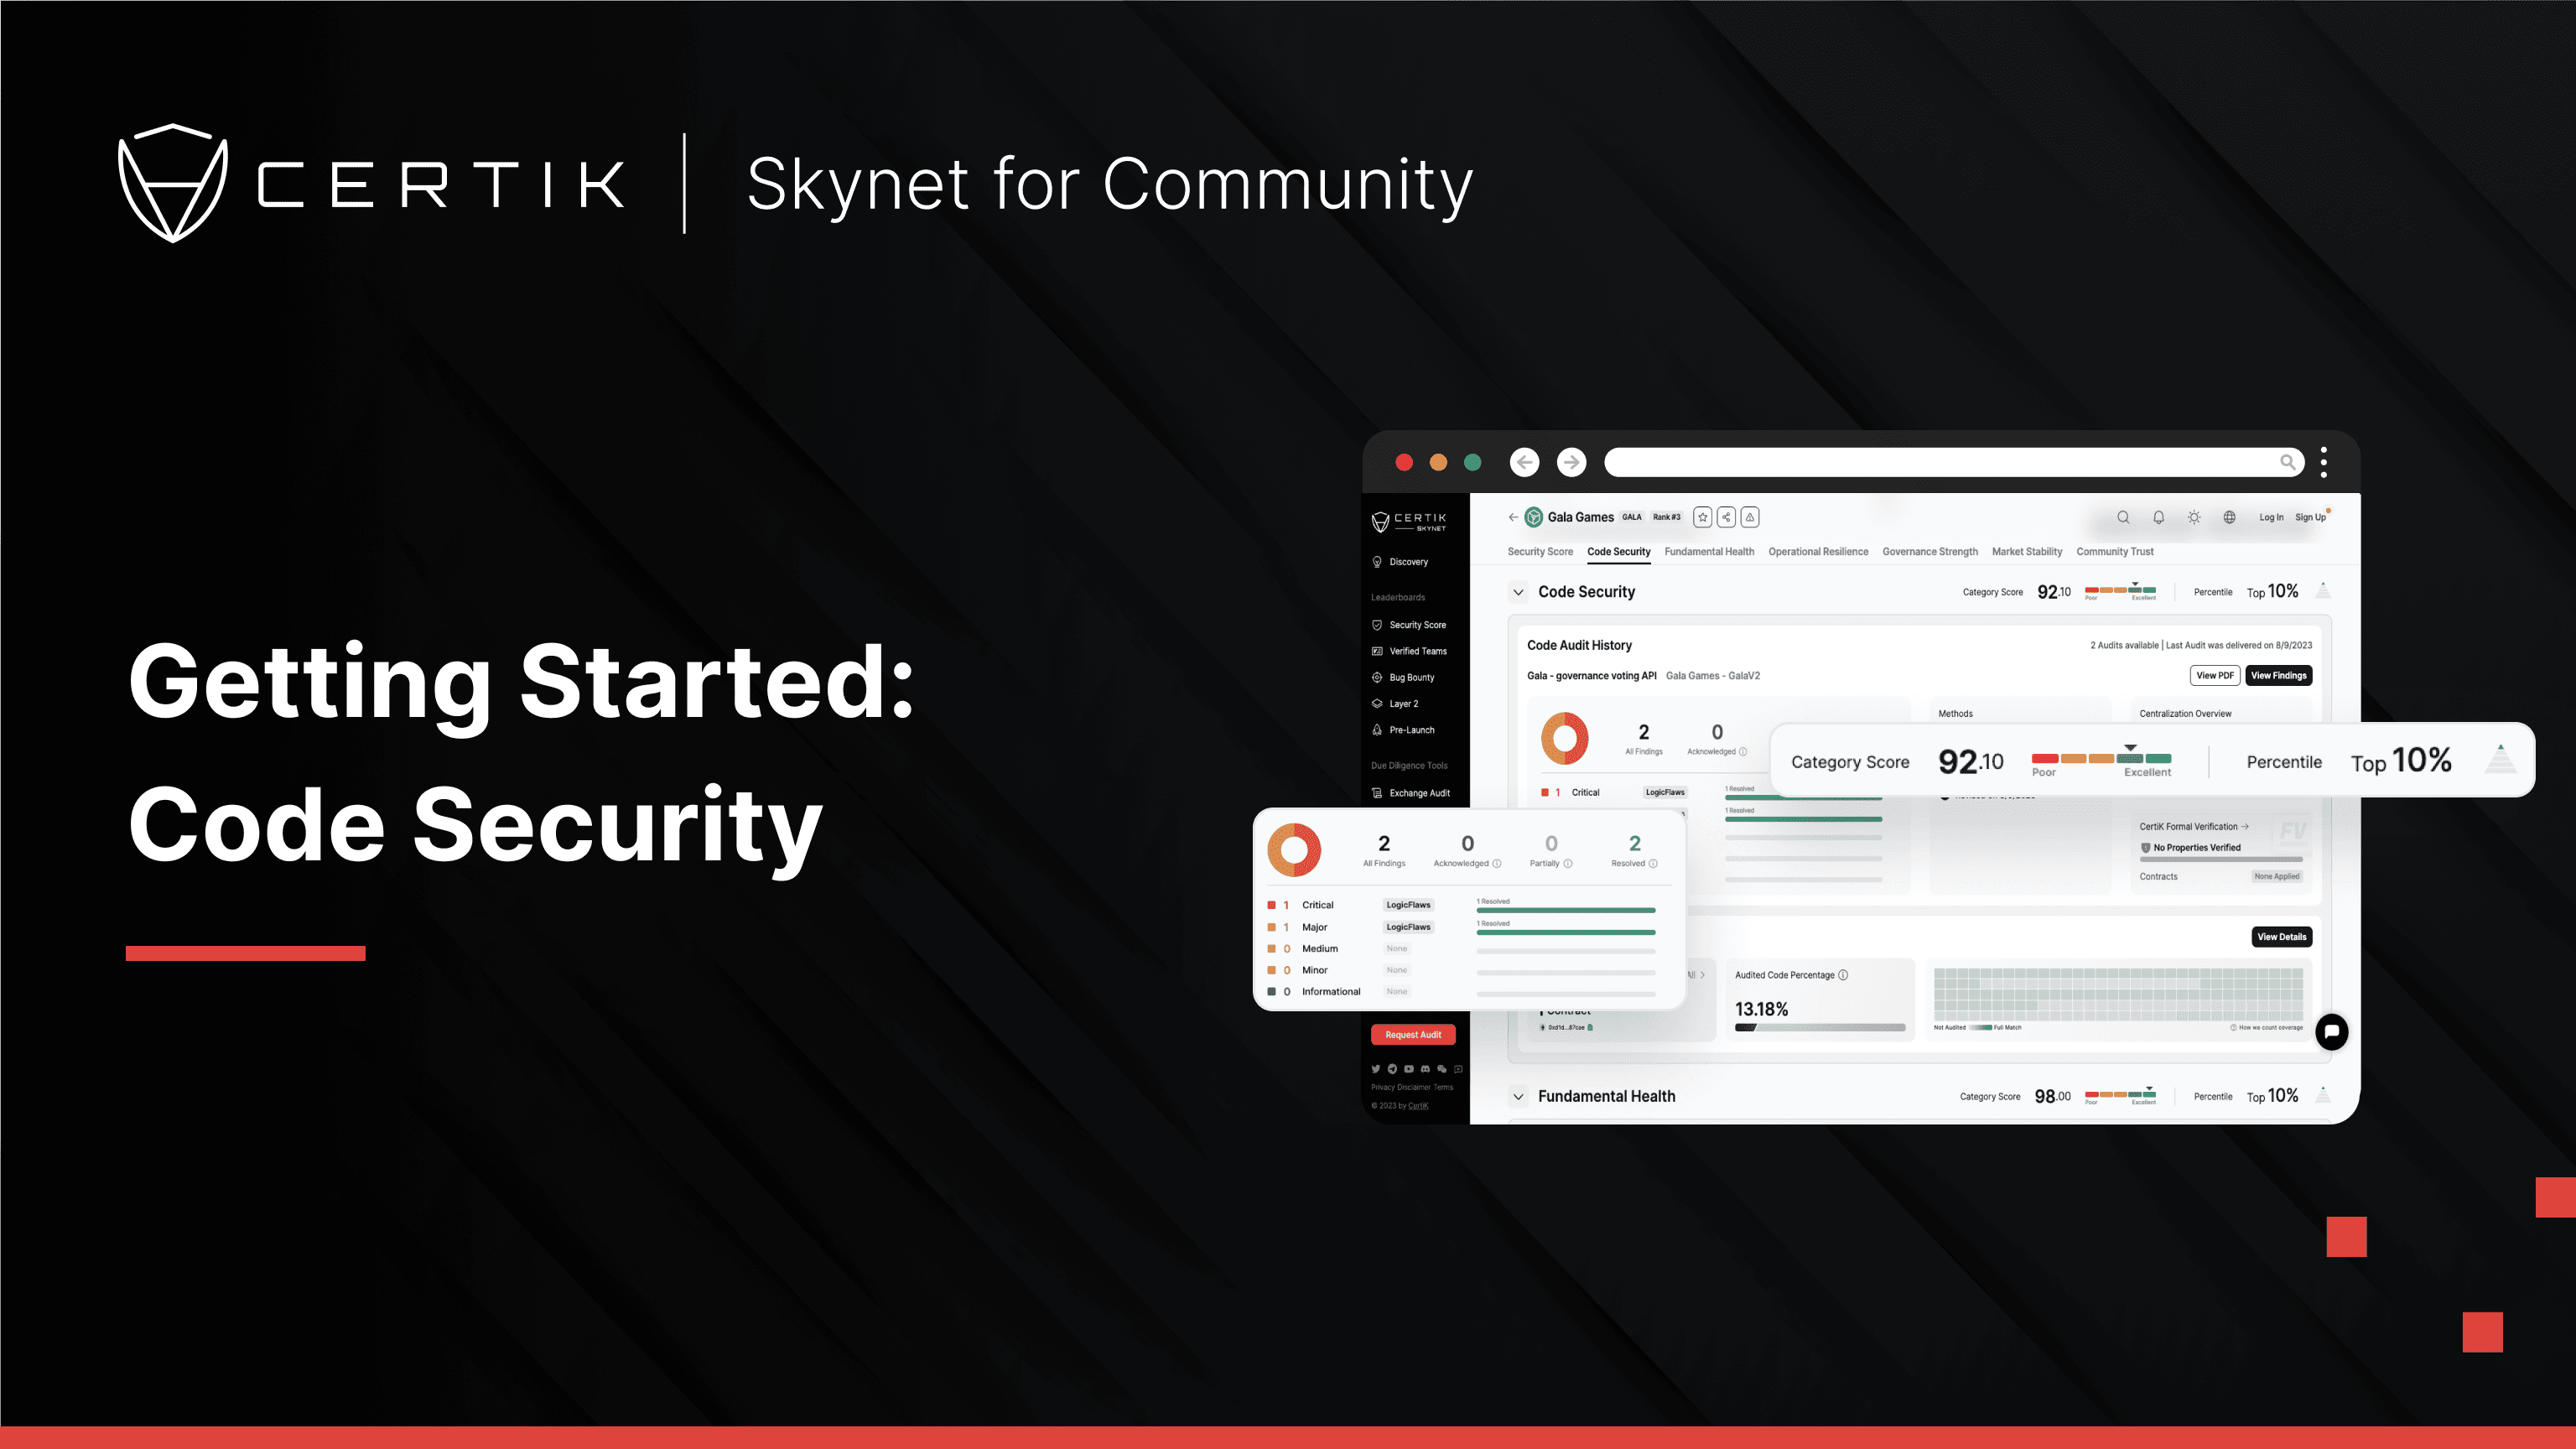
Guide · 7 min read
Code Security
The Code Security module contains all the audit reports that are available for a project and provides a detailed overview of the audit findings.